A group of friends wanted to play cards with two identical packs together. While shuffling the cards, three cards are dropped. Rest of the cards are shuffled and one card is drawn at random. Assuming that the dropped cards were a queen of hearts, a ten of spades and an ace of clubs, answer the following questions : (i) Find the probability that the drawn card is a face card. (1) (ii) Find the probability that the drawn card is either a king or a queen. (1) (iii) (a) Do you think that the probability of getting a queen was higher if none of the cards were dropped ? Justify your answer. (2) OR (iii) (b) Find the probability that the drawn card is a jack. Compare it with the probability when none of the cards were dropped. In which case is the probability of getting a jack higher ? (2)
Show answer & solution
Answer: (i) 10123 (ii) 10115 (iii) (a) Yes: 131>1017; OR (b) 1018, which is higher than 1048=131 when no card is dropped
Two packs: 104 cards; after dropping 3, 101 cards remain
(i) Face cards: 24, one (queen of hearts) dropped, so 23; P =10123
(ii) Kings 8, queens 8−1=7: P =10115
(iii) (a) Now P(queen) =1017≈0.069; with no card dropped P(queen) =1048=131≈0.077
So yes, the probability was higher if no card was dropped
(iii) (b) All 8 jacks remain: P(jack) =1018; with no card dropped P(jack) =1048=131
1018>1048, so the probability of a jack is higher in the present case (cards dropped)
Rahul is a lucky charm for his cricket team. He has a jar of cards with numbers from 10 to 74. Before each match, he draws a card from the jar. If the card bears an even number, the team wins. If the number is even and divisible by 5, they win by a big margin. If the number is an odd number less than 30, they win by a small margin. And if the number is a prime number between 50 and 74, they lose. Answer the following questions if Rahul draws a card today : (i) What is the probability that Rahul draws a card with an even number ? (1) (ii) What is the probability that Rahul draws a card with an odd number less than 30 ? (1) (iii) (a) What is the probability that Rahul draws a card with a prime number between 50 and 74 ? (2) OR (iii) (b) What is the probability that Rahul draws a card with an even number divisible by 5 ? (2)
Show answer & solution
Answer: (i) 6533 (ii) 132 (iii) (a) 656; OR (b) 657
Total cards: 10 to 74, i.e. 74−10+1=65
(i) Even numbers 10, 12, ..., 74: 274−10+1=33; P =6533
(ii) Odd numbers less than 30: 11, 13, ..., 29, i.e. 10 numbers; P =6510=132
(iii) (a) Primes between 50 and 74: 53, 59, 61, 67, 71, 73, i.e. 6; P =656
(iii) (b) Even numbers divisible by 5 are multiples of 10: 10, 20, ..., 70, i.e. 7; P =657
Family structure : In a recent survey of this year, 51% of the families in the United States of America had no children, 20% had one child, 19% had two children, 7% had three children and 3% had four or more children. A family is selected at random. Based on the above information, answer the following questions : (i) Find the probability that the selected family has two or three children. (1) (ii) Find the probability that the selected family has more than one child. (1) (iii) (a) Find the probability that the selected family has less than three children. (2) OR (b) Find the probability that the selected family has more than two children. (2)
Show answer & solution
Answer: (i) 5013 (ii) 10029 (iii) (a) 109 OR (b) 101
Take 100 families: 51 with no child, 20 with one, 19 with two, 7 with three, 3 with four or more.
(i) Two or three children: 19+7=26, P =10026=5013.
(ii) More than one child: 19+7+3=29, P =10029.
(iii) (a) Less than three children: 51+20+19=90, P =10090=109.
(iii) (b) More than two children: 7+3=10, P =10010=101.
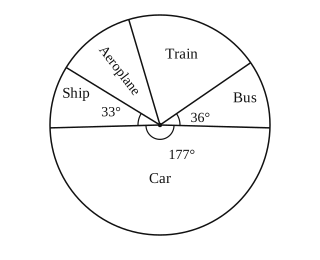
In a survey on holidays, 120 people were asked to state which type of transport they used on their last holiday. The following pie chart shows the results of the survey. Observe the pie chart and answer the following questions : (i) If one person is selected at random, find the probability that he/she travelled by bus or ship. (1) (ii) Which is most favourite mode of transport and how many people used it ? (1) (iii) (a) A person is selected at random. If the probability that he did not use train is 4/5, find the number of people who used train. (2) OR (b) The probability that randomly selected person used aeroplane is 7/60. Find the revenue collected by air company at the rate of ₹ 5,000 per person. (2)
Show answer & solution
Answer: (i) 12023 (ii) Car, 59 people (iii) (a) 24 OR (b) ₹70,000
120 people correspond to 360∘, so each person is 3∘.
Blood group describes the type of blood a person has. It is a classification of blood based on the presence or absence of inherited antigenic substances on the surface of red blood cells. Blood types predict whether a serious reaction will occur in a blood transfusion. In a sample of 50 people, 21 had type O blood, 22 had type A, 5 had type B and rest had type AB blood group. Based on the above, answer the following questions : (i) What is the probability that a person chosen at random had type O blood ? (1) (ii) What is the probability that a person chosen at random had type AB blood group ? (1) (iii) What is the probability that a person chosen at random had neither type A nor type B blood group ? (2) OR (iii) What is the probability that person chosen at random had either type A or type B or type O blood group ? (2)
Show answer & solution
Answer: (i) 5021 (ii) 251 (iii) 5023; OR (iii) 2524
Number with type AB = 50 − 21 − 22 − 5 = 2.
(i) P(O) =5021
(ii) P(AB) =502=251
(iii) Neither A nor B means O or AB: 5021+2=5023
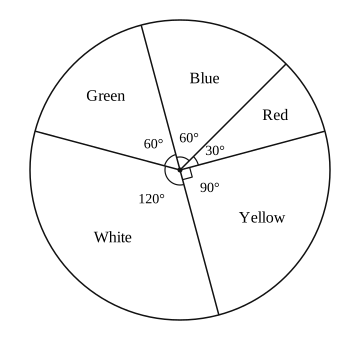
Some students were asked to list their favourite colour. The measure of each colour is shown by the central angle of a pie chart given below : Study the pie chart and answer the following questions : (i) If a student is chosen at random, then find the probability of his/her favourite colour being white ? (1) (ii) What is the probability of his/her favourite colour being blue or green ? (1) (iii) (a) If 15 students liked the colour yellow, how many students participated in the survey ? (2) OR (iii) (b) What is the probability of the favourite colour being red or blue ? (2)
Show answer & solution
Answer: (i) 31 (ii) 31 (iii) (a) 60 OR (b) 41
(i) P(white) =360120=31.
(ii) P(blue or green) =36060+60=31.
(iii) (a) Yellow has 90∘, i.e. 36090=41 of the students. So total =15×4=60.
Computer-based learning (CBL) refers to any teaching methodology that makes use of computers for information transmission. At an elementary school level, computer applications can be used to display multimedia lesson plans. A survey was done on 1000 elementary and secondary schools of Assam and they were classified by the number of computers they had. Number of Computers: 1 – 10, 11 – 20, 21 – 50, 51 – 100, 101 and more Number of Schools: 250, 200, 290, 180, 80 One school is chosen at random. Then : (i) Find the probability that the school chosen at random has more than 100 computers. (1) (ii) (a) Find the probability that the school chosen at random has 50 or fewer computers. (2) OR (ii) (b) Find the probability that the school chosen at random has no more than 20 computers. (2) (iii) Find the probability that the school chosen at random has 10 or less than 10 computers. (1)
Show answer & solution
Answer: (i) 252 (ii) (a) 5037 OR (b) 209 (iii) 41
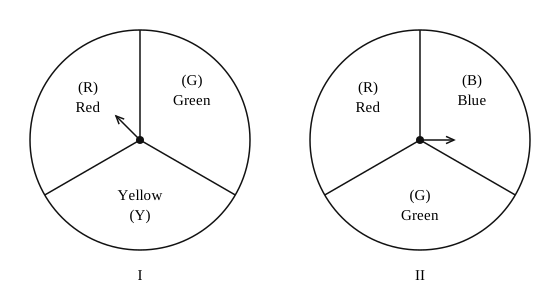
A middle school decided to run the following spinner game as a fund-raiser on Christmas Carnival. Making Purple : Spin each spinner once. Blue and red make purple. So, if one spinner shows Red (R) and another Blue (B), then you ‘win’. One such outcome is written as ‘RB’. Based on the above, answer the following questions : (i) List all possible outcomes of the game. (1) (ii) Find the probability of ‘Making Purple’. (1) (iii) For each win, a participant gets ₹ 10, but if he/she loses, he/she has to pay ₹ 5 to the school. If 99 participants played, calculate how much fund could the school have collected. (2) OR (iii) If the same amount of ₹ 5 has been decided for winning or losing the game, then how much fund had been collected by school ? (Number of participants = 99) (2)
“Eight Ball” is a game played on a pool table with 15 balls numbered 1 to 15 and a “cue ball” that is solid and white. Of the 15 numbered balls, eight are solid (non-white) coloured and numbered 1 to 8 and seven are striped balls numbered 9 to 15. The 15 numbered pool balls (no cue ball) are placed in a large bowl and mixed, then one ball is drawn out at random. Based on the above information, answer the following questions : (i) What is the probability that the drawn ball bears number 8 ? (ii) What is the probability that the drawn ball bears an even number ? OR What is the probability that the drawn ball bears a number, which is a multiple of 3 ? (iii) What is the probability that the drawn ball is a solid coloured and bears an even number ?
Show answer & solution
Answer: (i) 151 (ii) 157; OR: 31 (iii) 154
Total outcomes = 15.
(i) Only one ball bears 8: P = 151.
(ii) Even numbers: 2, 4, 6, 8, 10, 12, 14, i.e. 7 balls: P = 157.
OR: Multiples of 3: 3, 6, 9, 12, 15, i.e. 5 balls: P = 155=31.
(iii) Solid coloured balls are 1 to 8; even ones: 2, 4, 6, 8, i.e. 4 balls: P = 154.